
From To-Do Lists to Bubbles
The anti-list way to organise (when your visual processing is on overdrive)
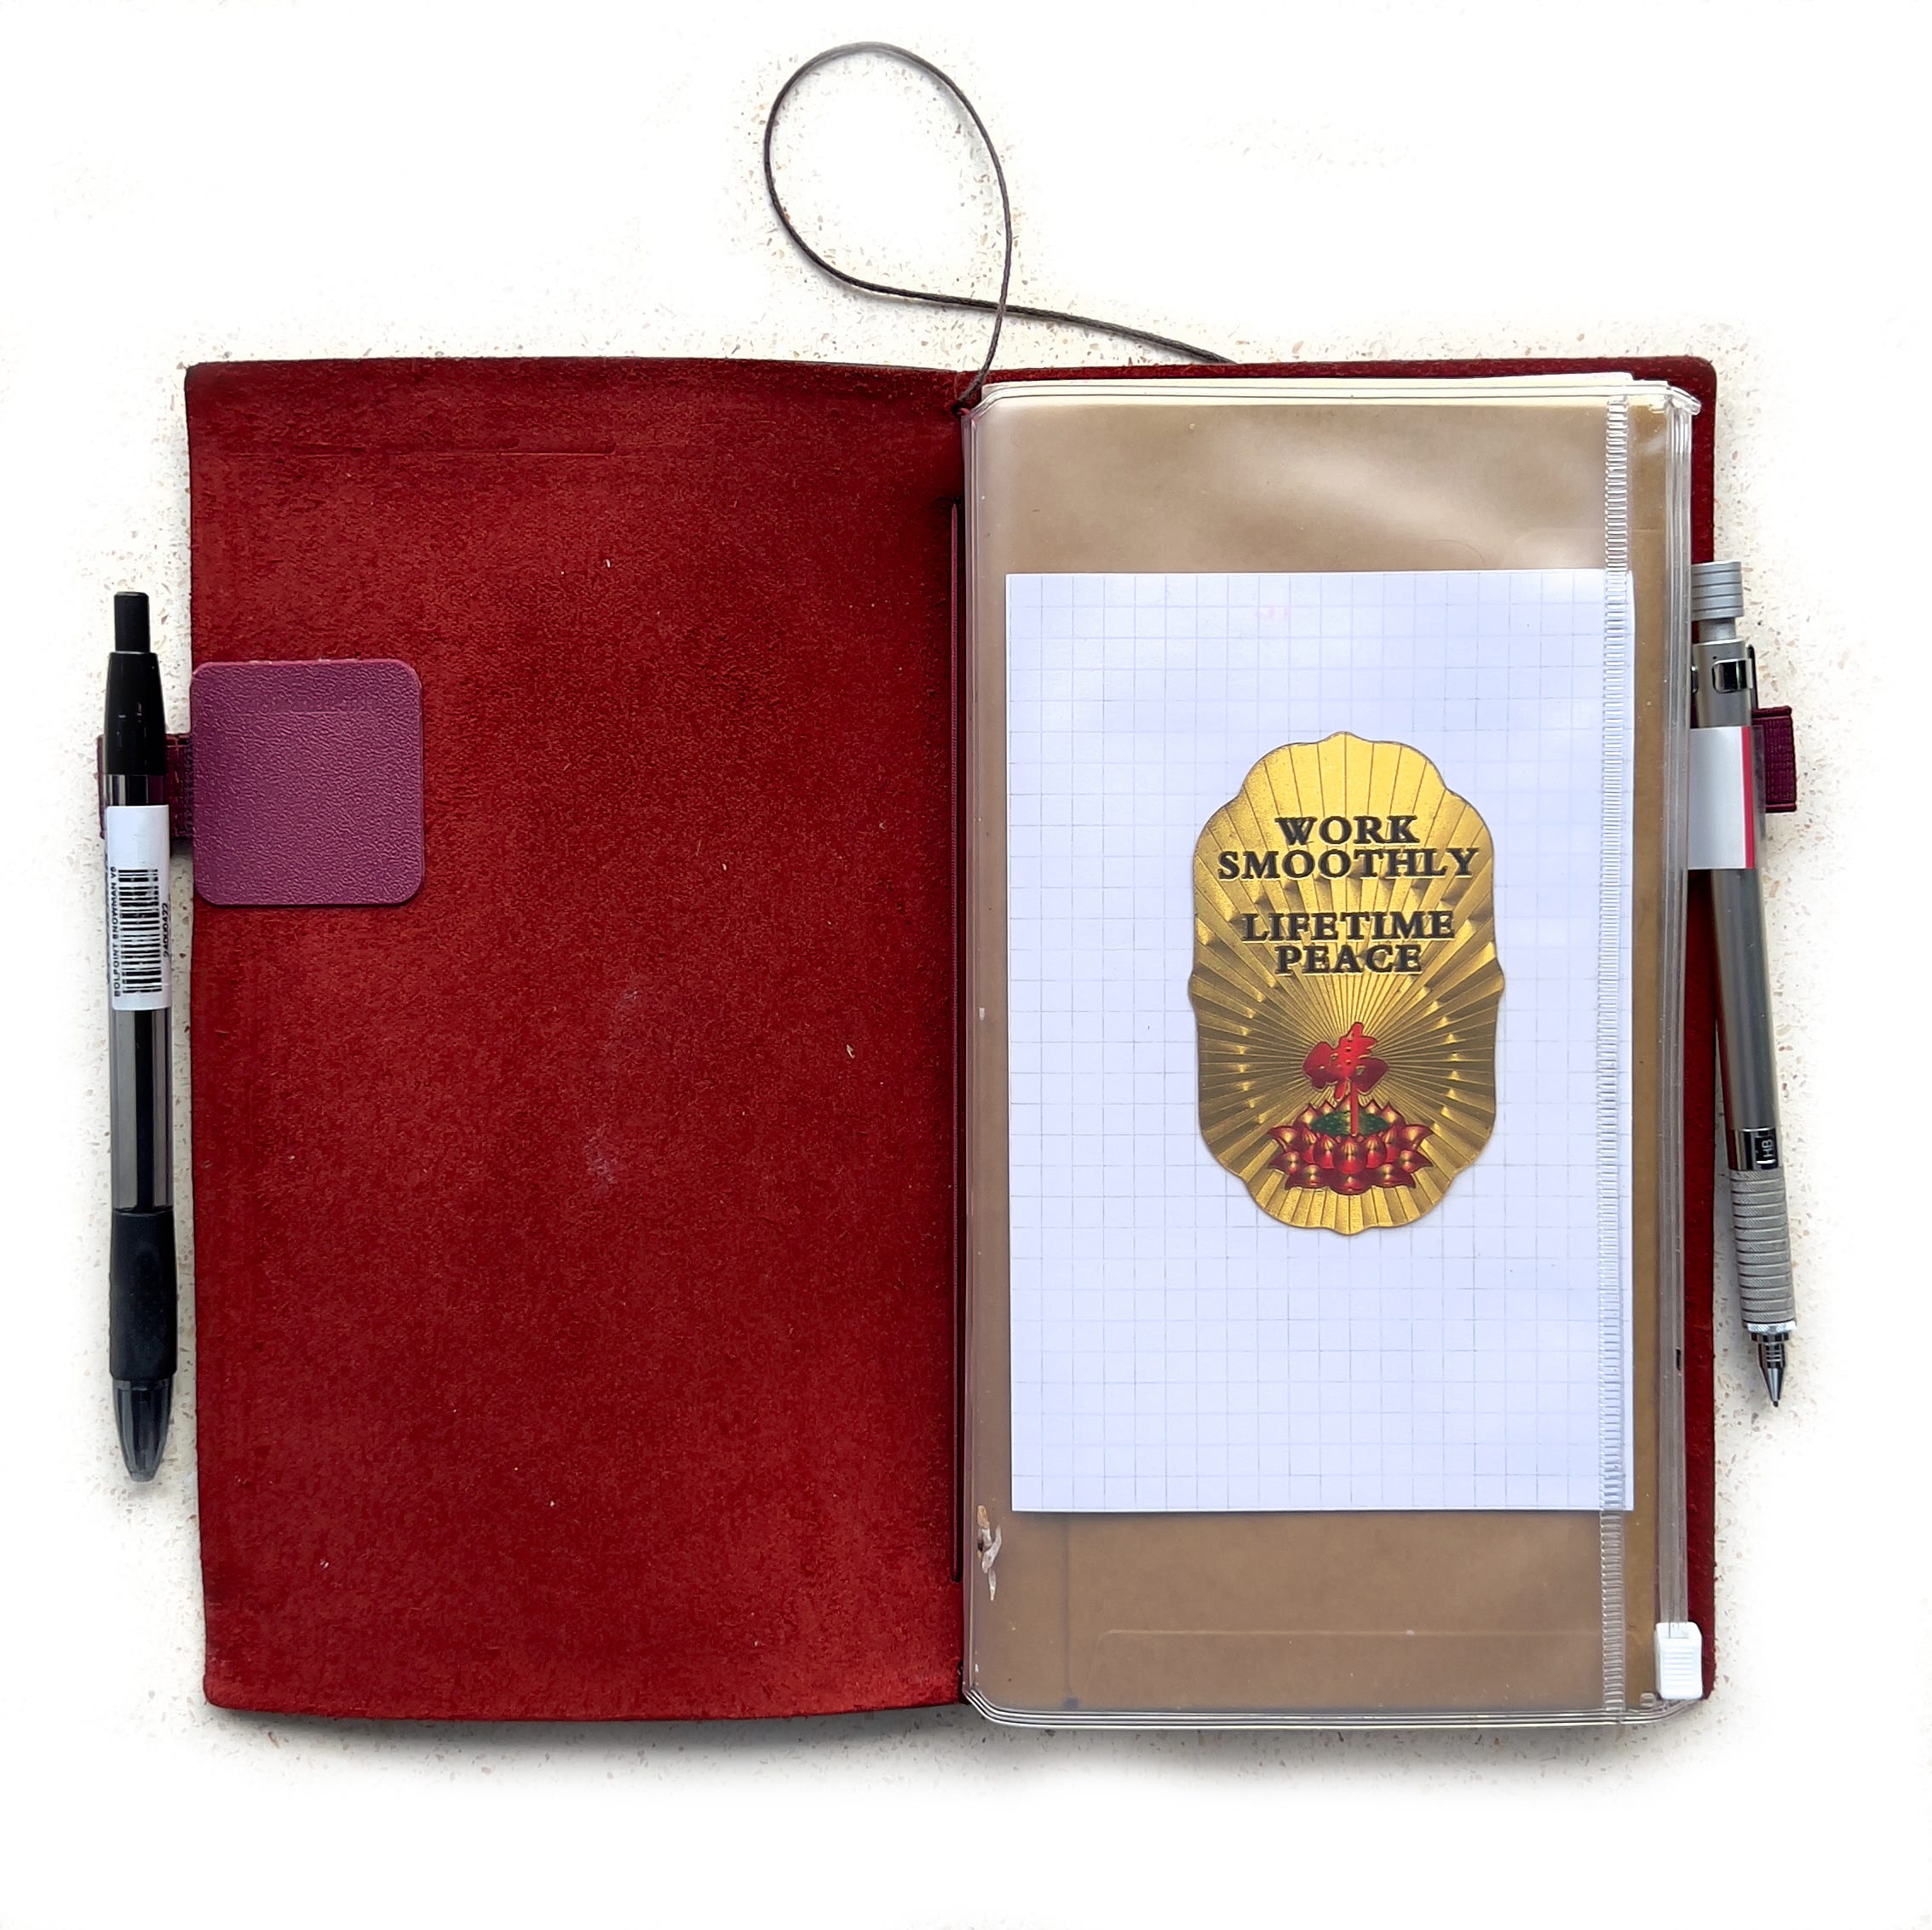
I struggled so much to stay organised with lists. I worked really hard at it, but it was always exhausting and ineffective. In perhaps some sort of neurodivergent way, I seem to process everything in my visual fied a lot so looking at a task list is just instantly overwhelming.
After many many years I have grown my own method of making it clear what I need to do and showing it to myself in a way that’s easy to process visually. And therefore doesn’t overwhelm me even before I have started to do a single thing that I ought to do.
Because something happens (at least in my brain) when I see a list. I read the whole list and then ALL the tasks get uploaded into my brain and I start thinking about ALL the things I have to do, processing them all at once. Instant exhaustion!
I share my improved process here, maybe it will be useful to you too. Also I think the process sometimes makes quite attractive diagrams.
And thanks to Mrs Blackwell’s Village Bookshop where I get most of my Traveler’s Notebook things in New Zealand. Also masses of delightful books and jigsaw puzzles.
DIAGRAMING LIFE - A WEEK AT A TIME
A week gets a double page spread in dot grid workbook. Currently a Traveler’s Notebook dot grid insert.
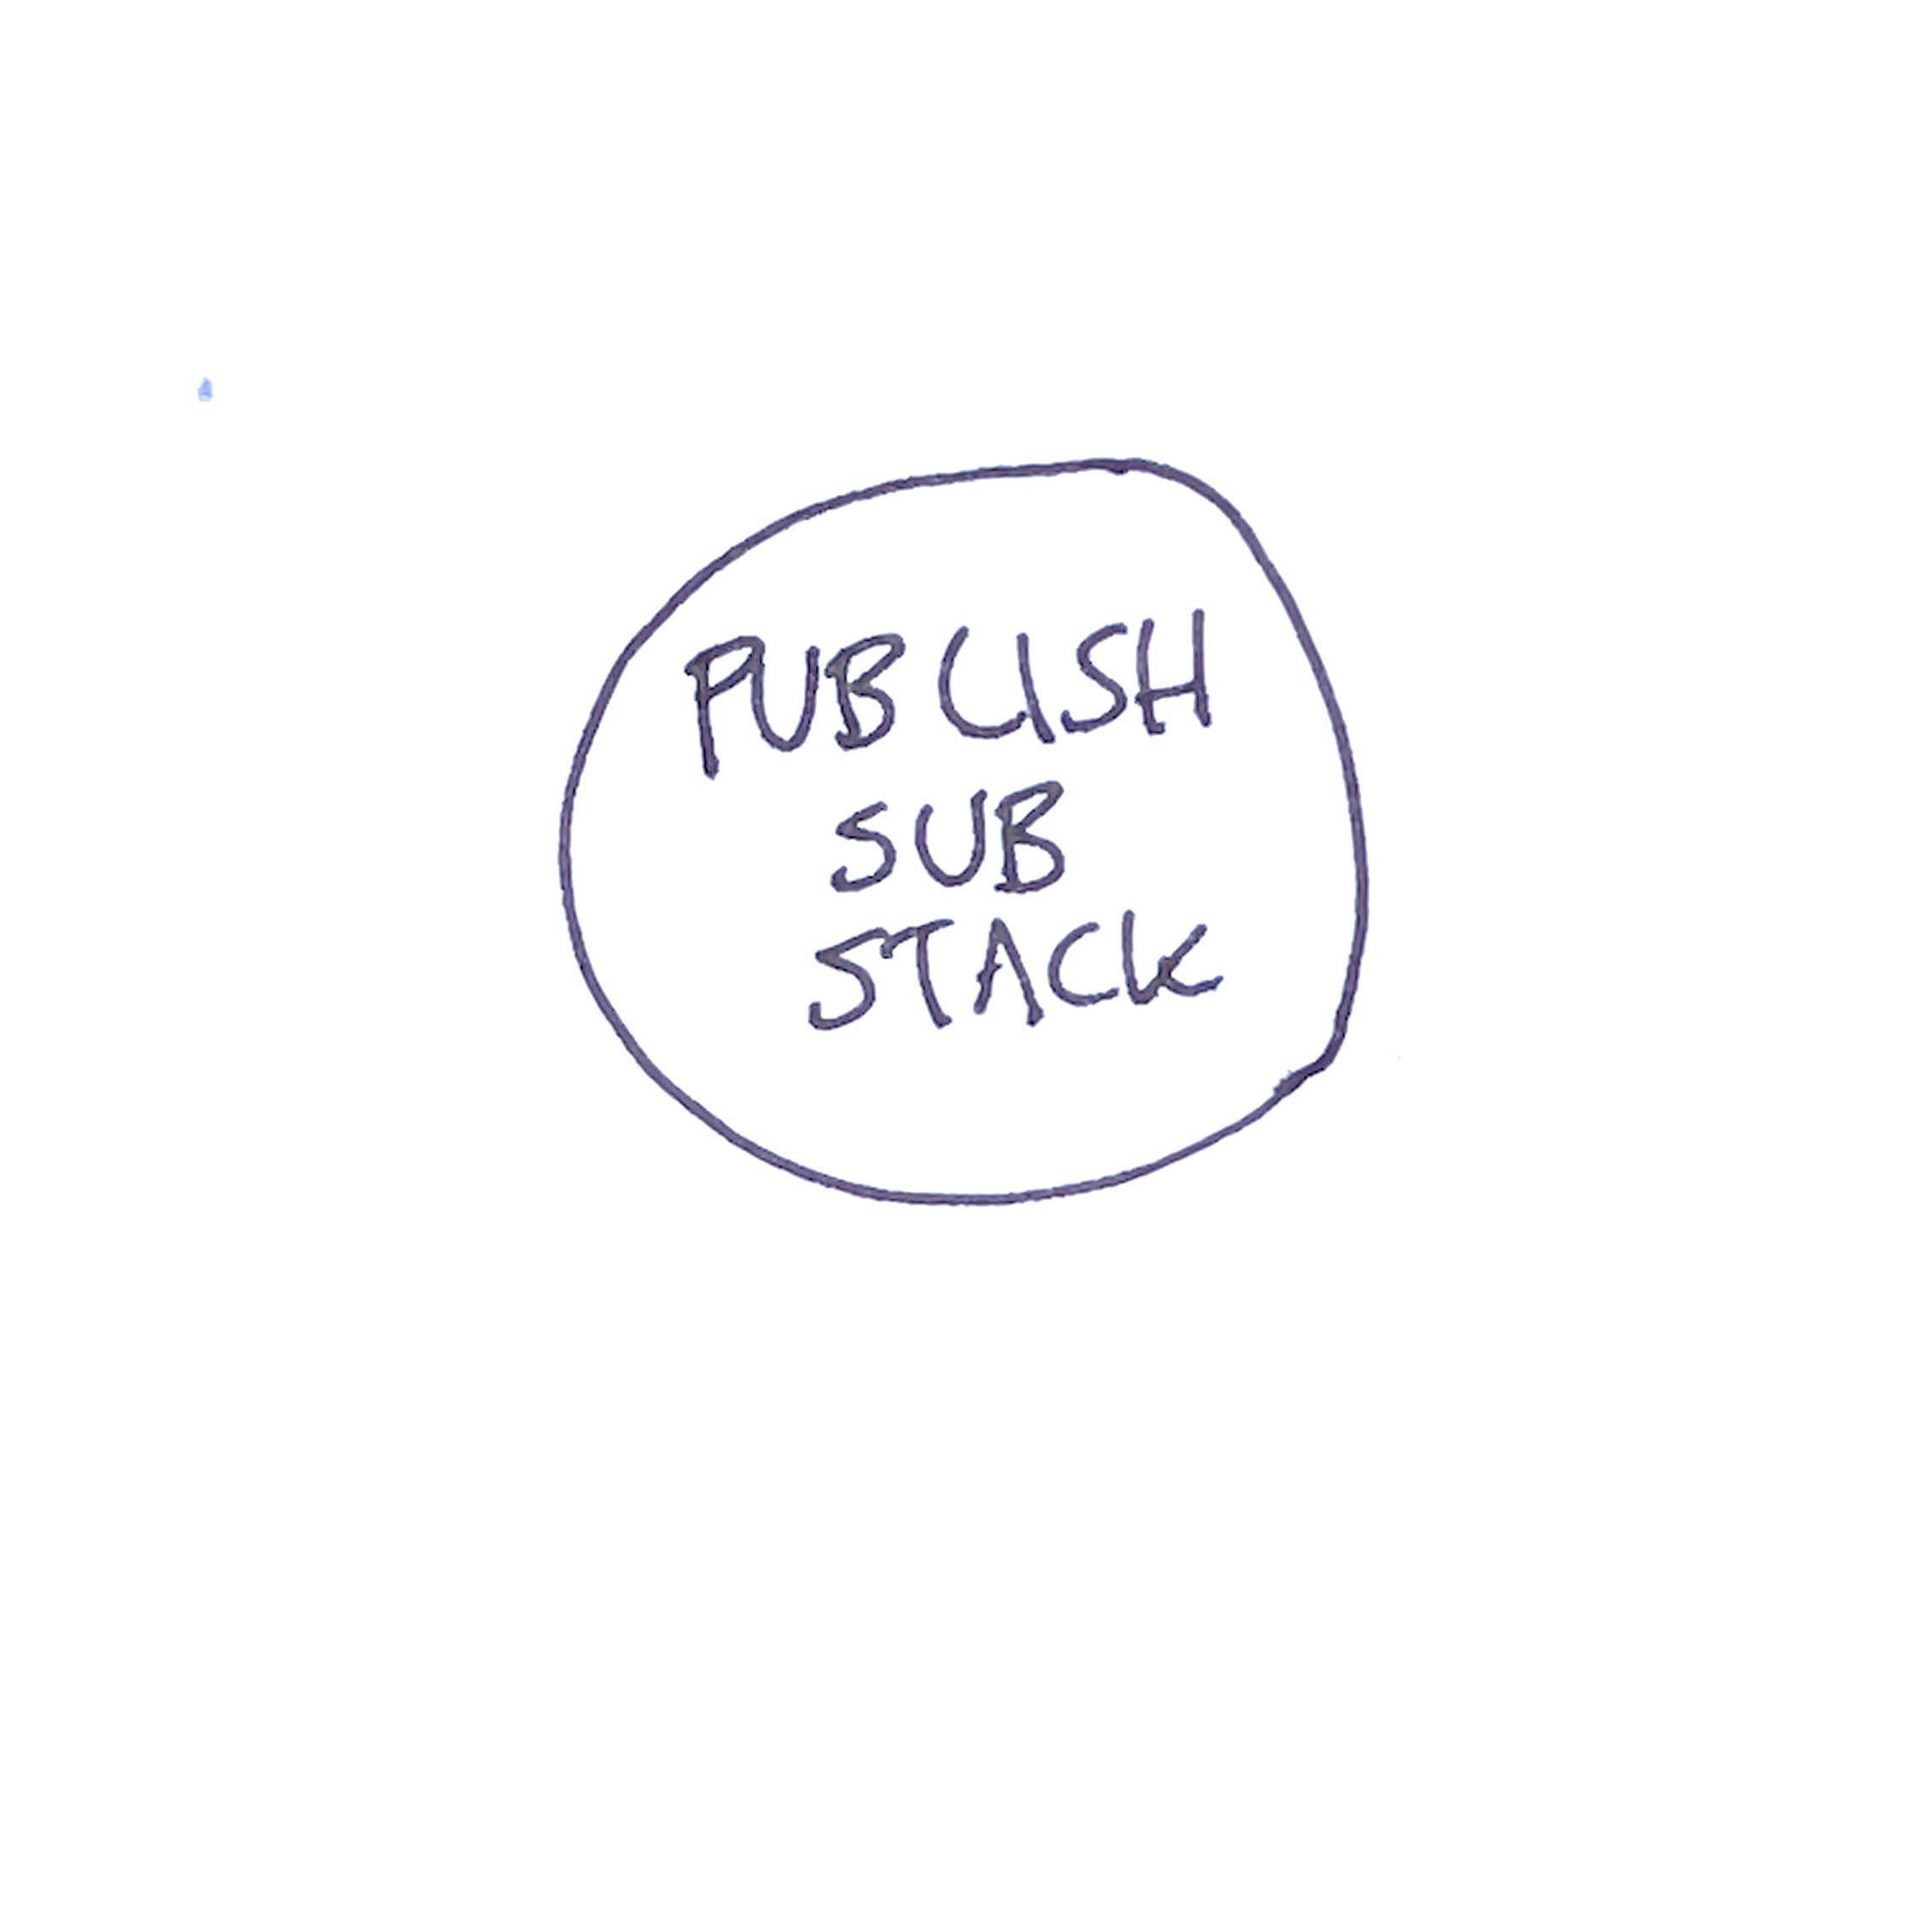
All the aims or projects for the week get nice big circles in the weekly layout. The more important the project, the bigger the circle.
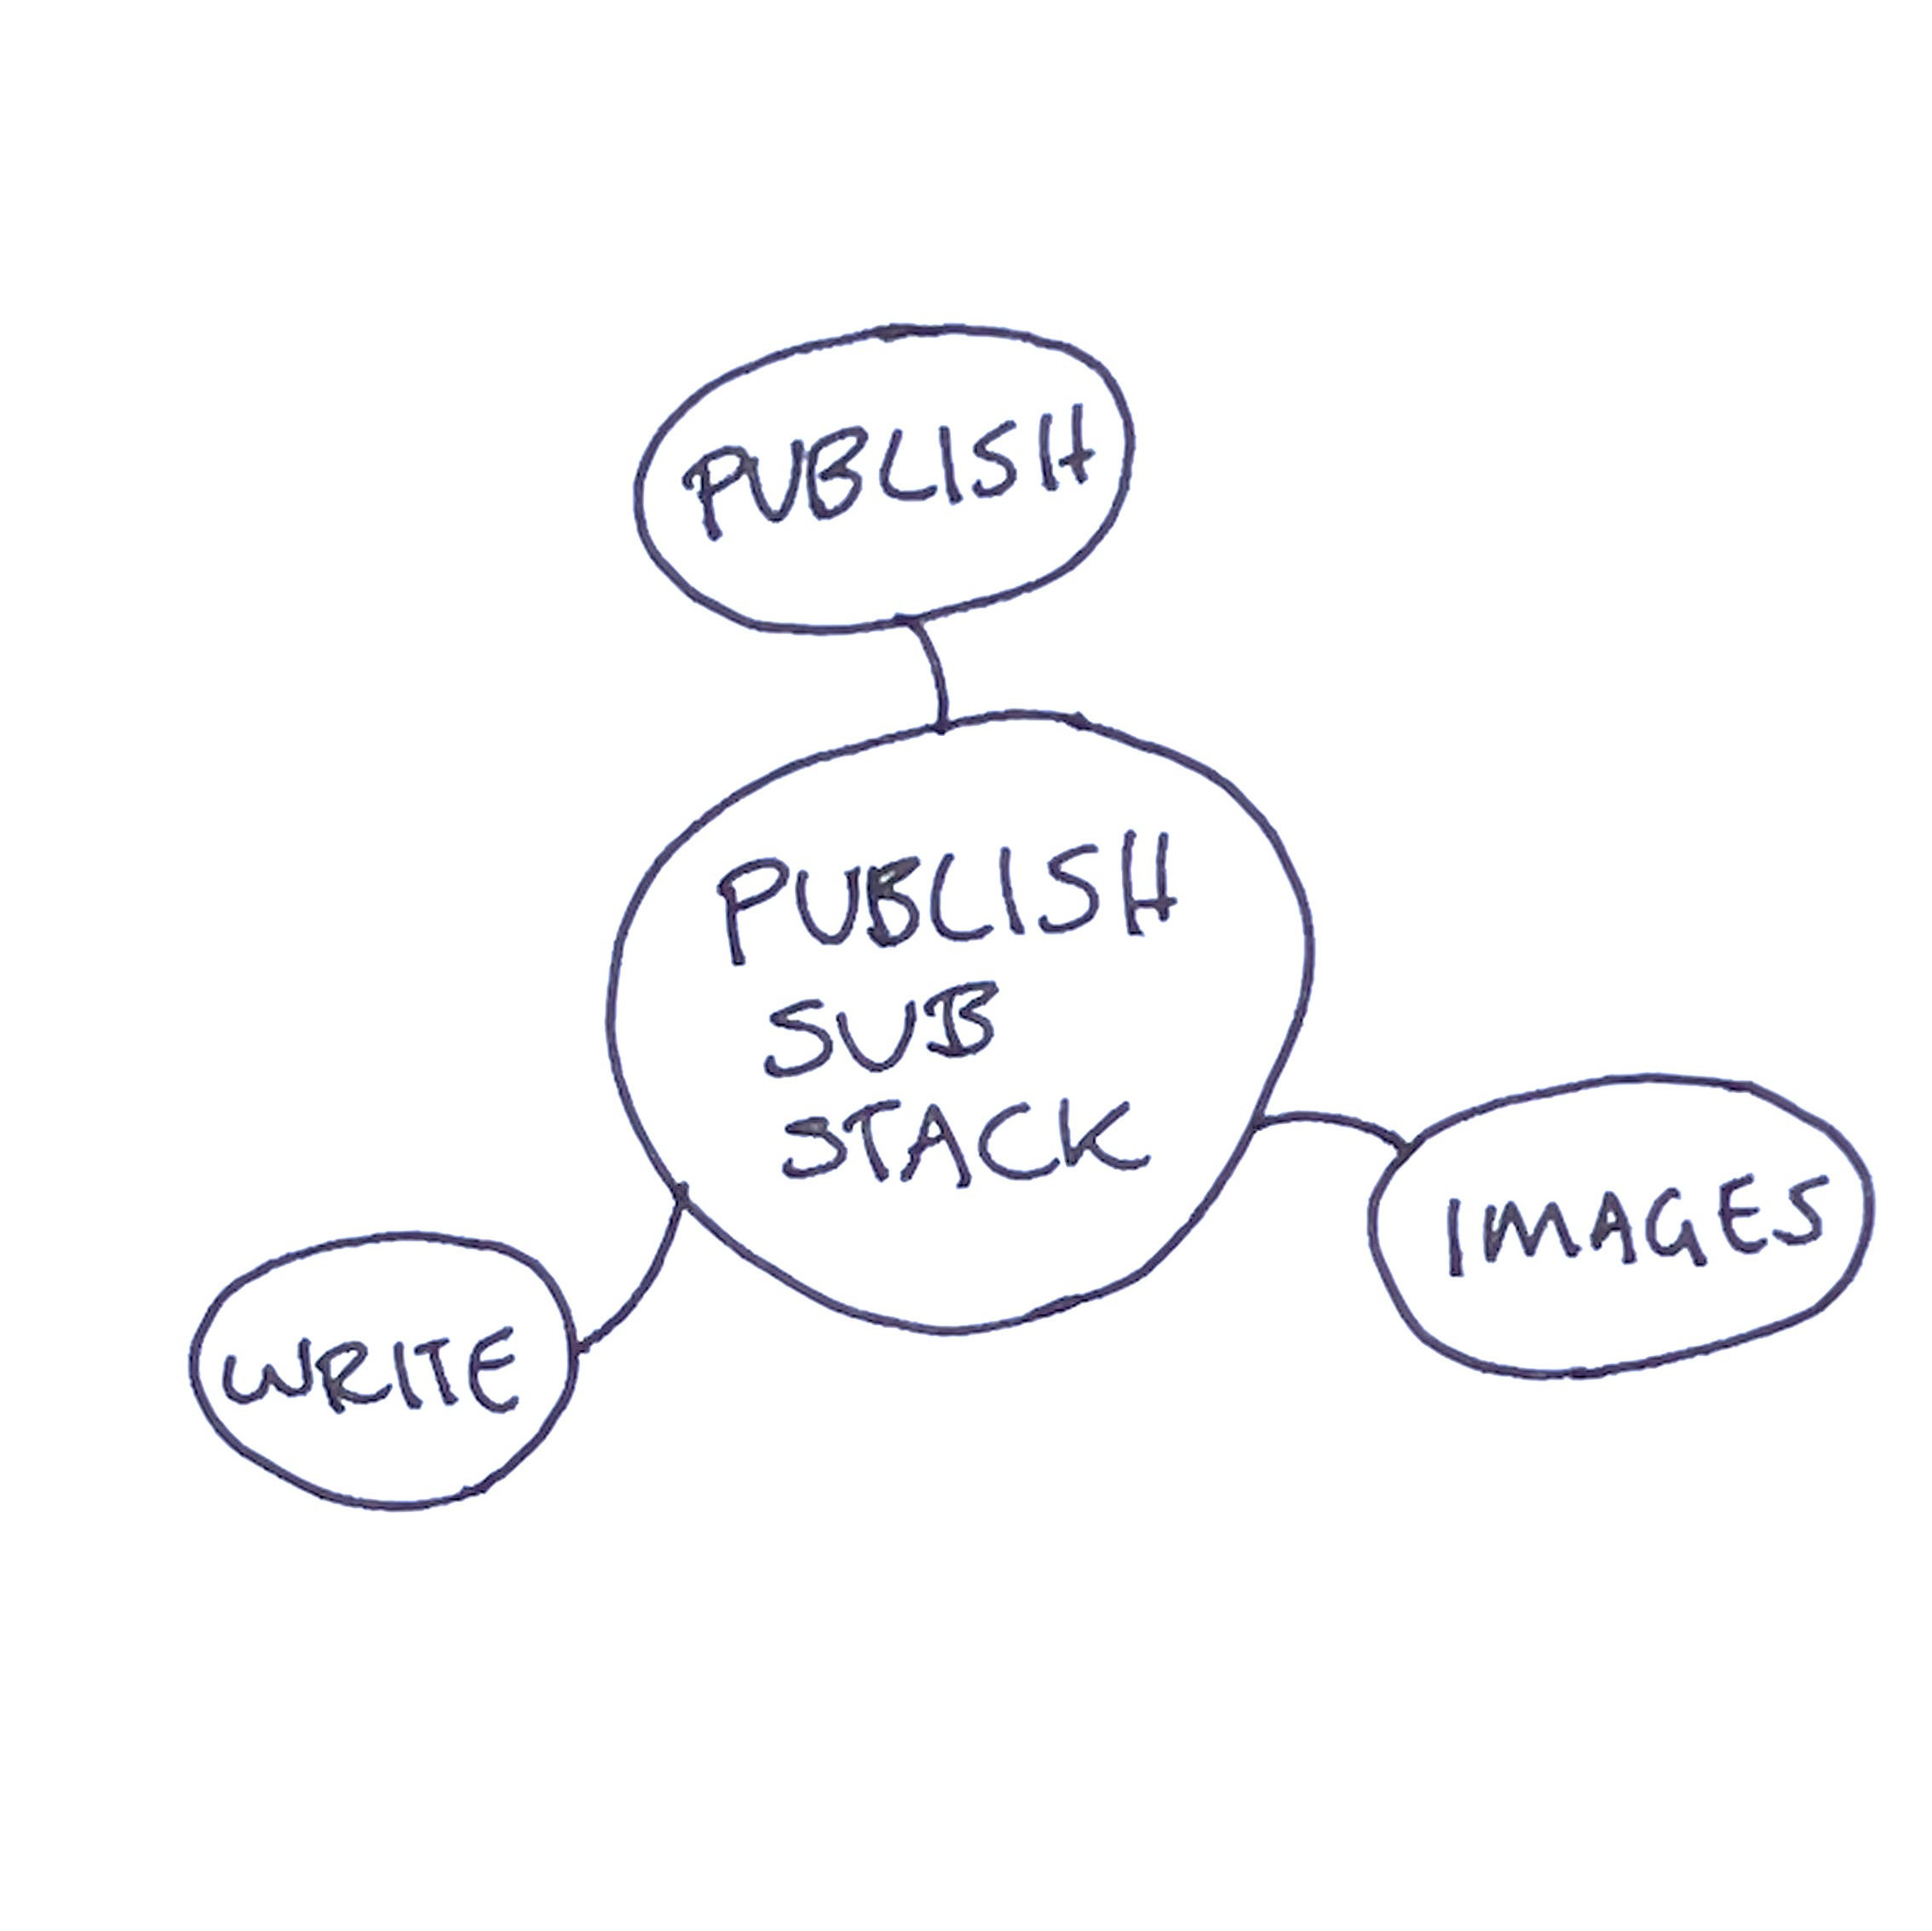
Next step is to figure out all the littler things that need to be done to get the project done. These all get their own little bubbles, attached to the big main project bubble.
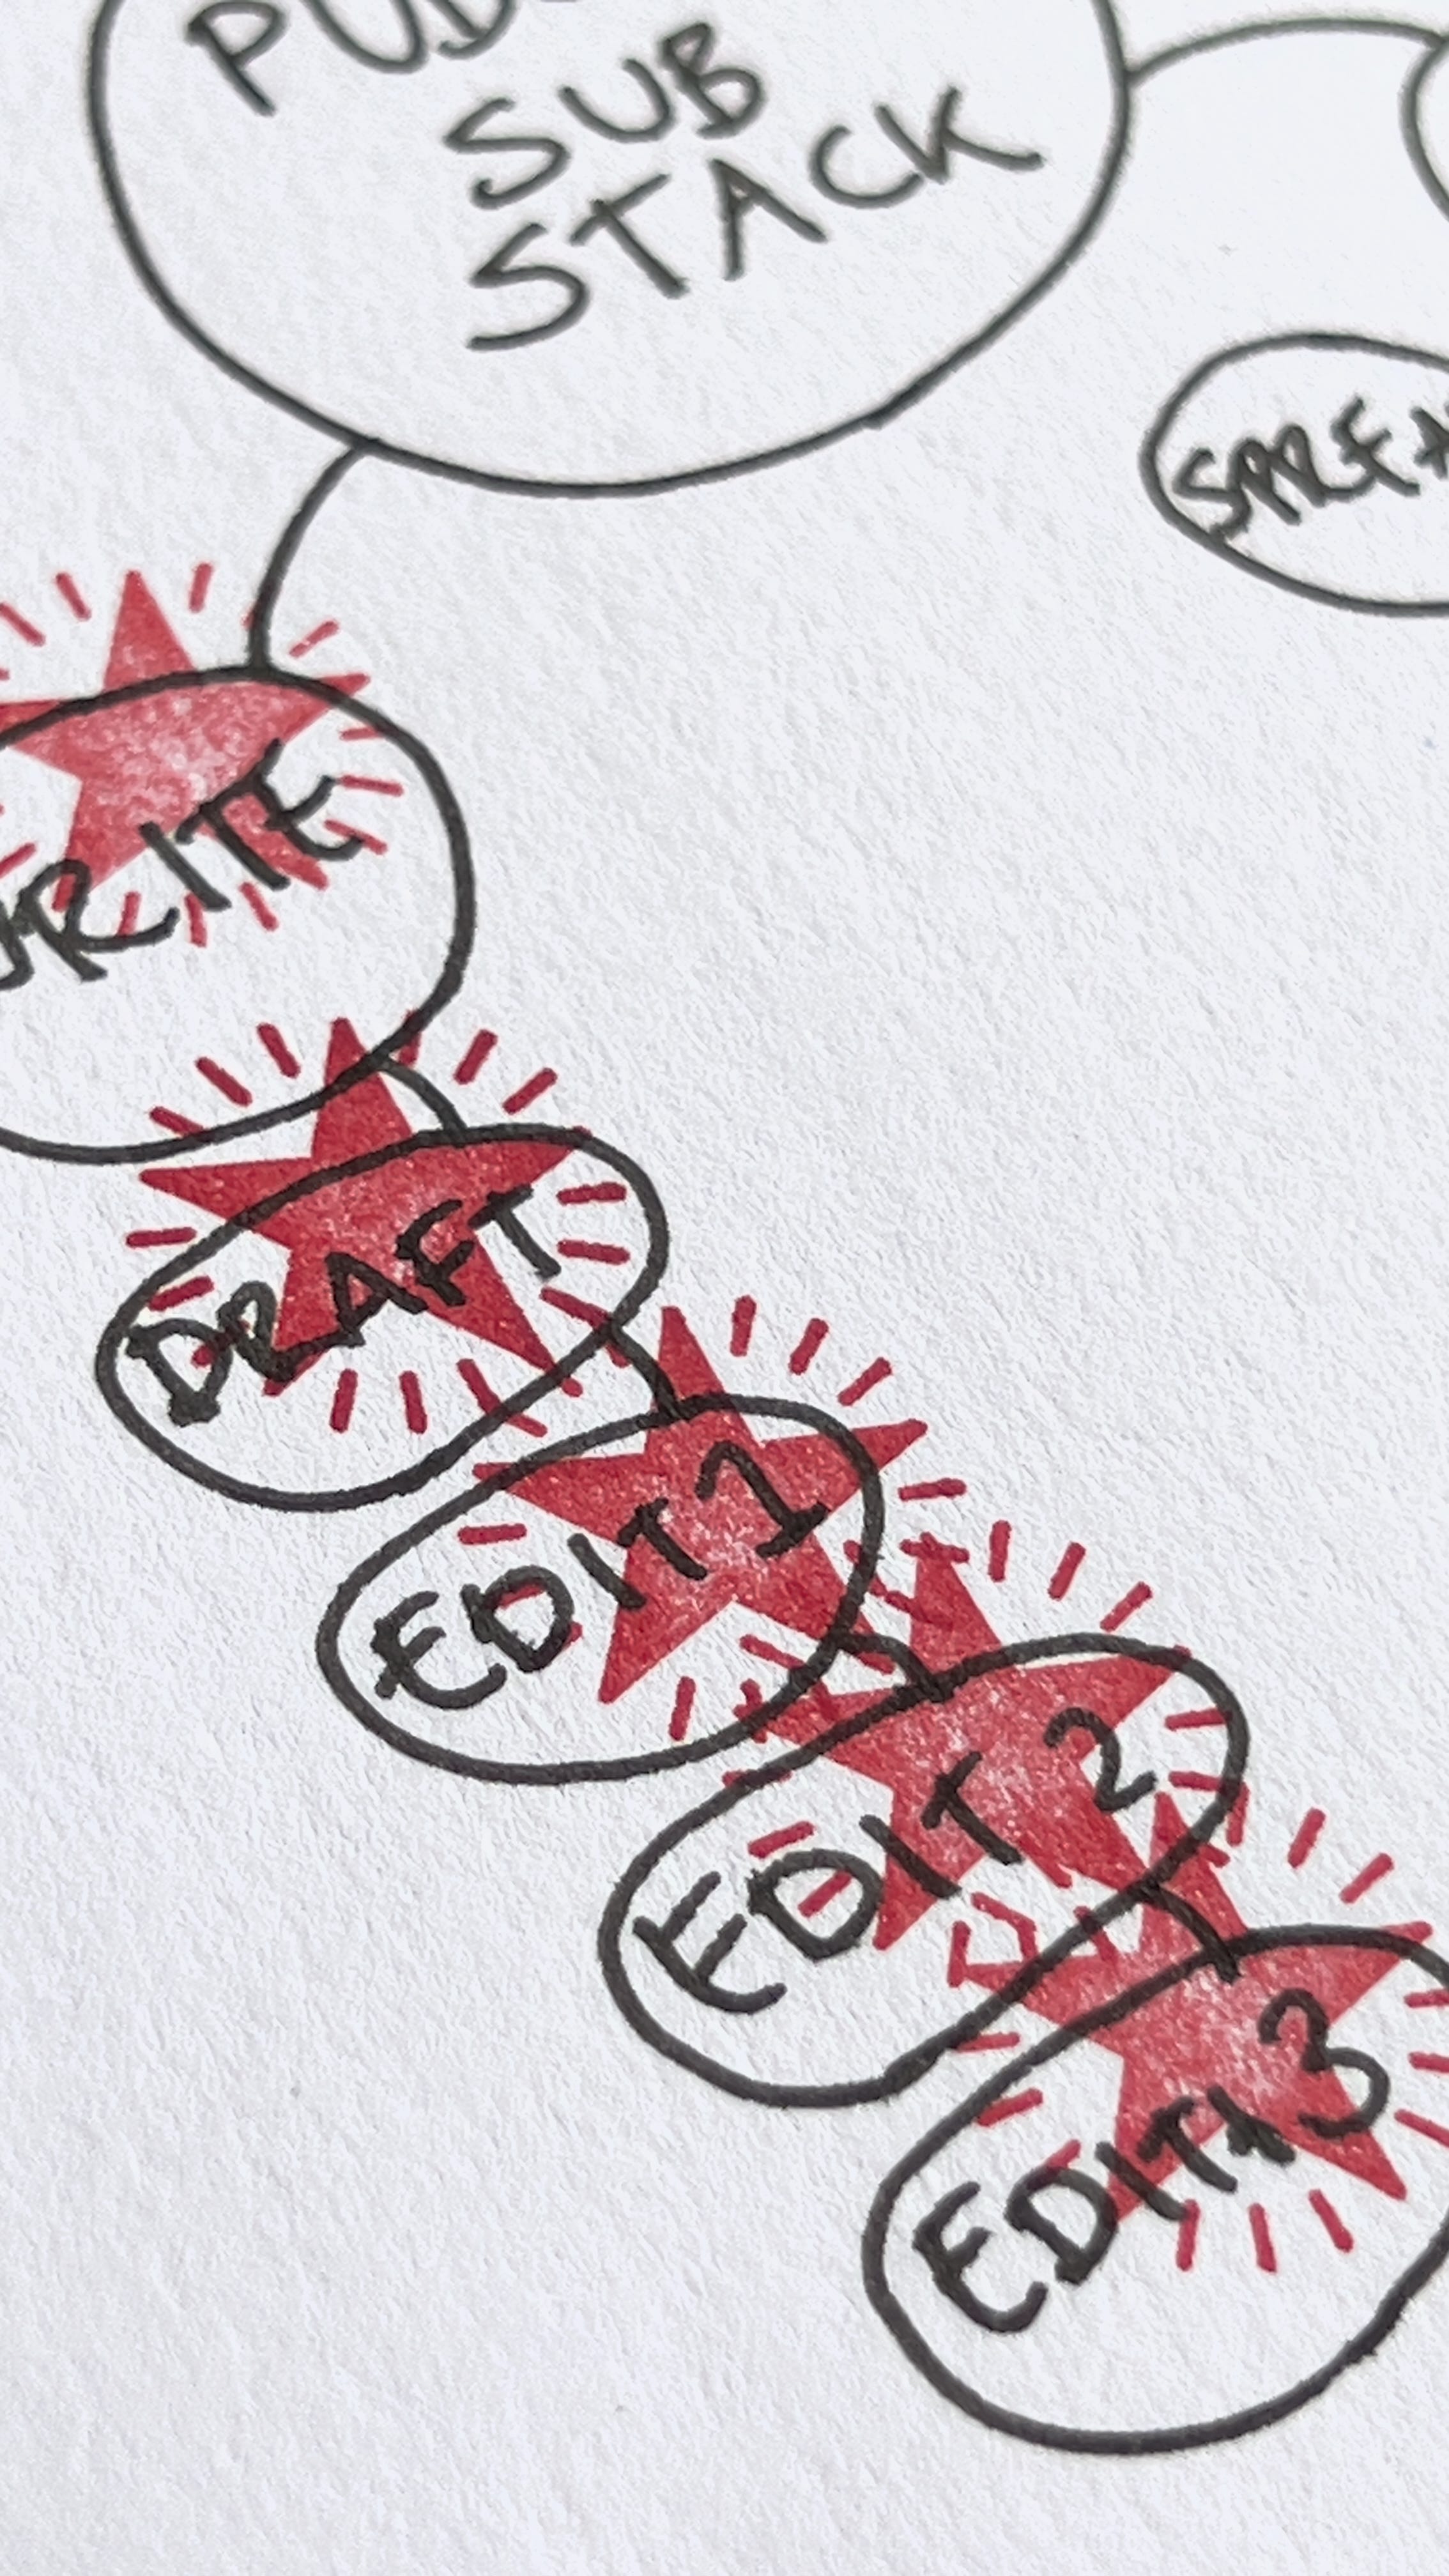
Sometimes these get organised into groups of sub-tasks. So for example a Substack post might need several writing tasks and several photography tasks. So these get organised into series of related sub-tasks. Hopefully this makes it clear.
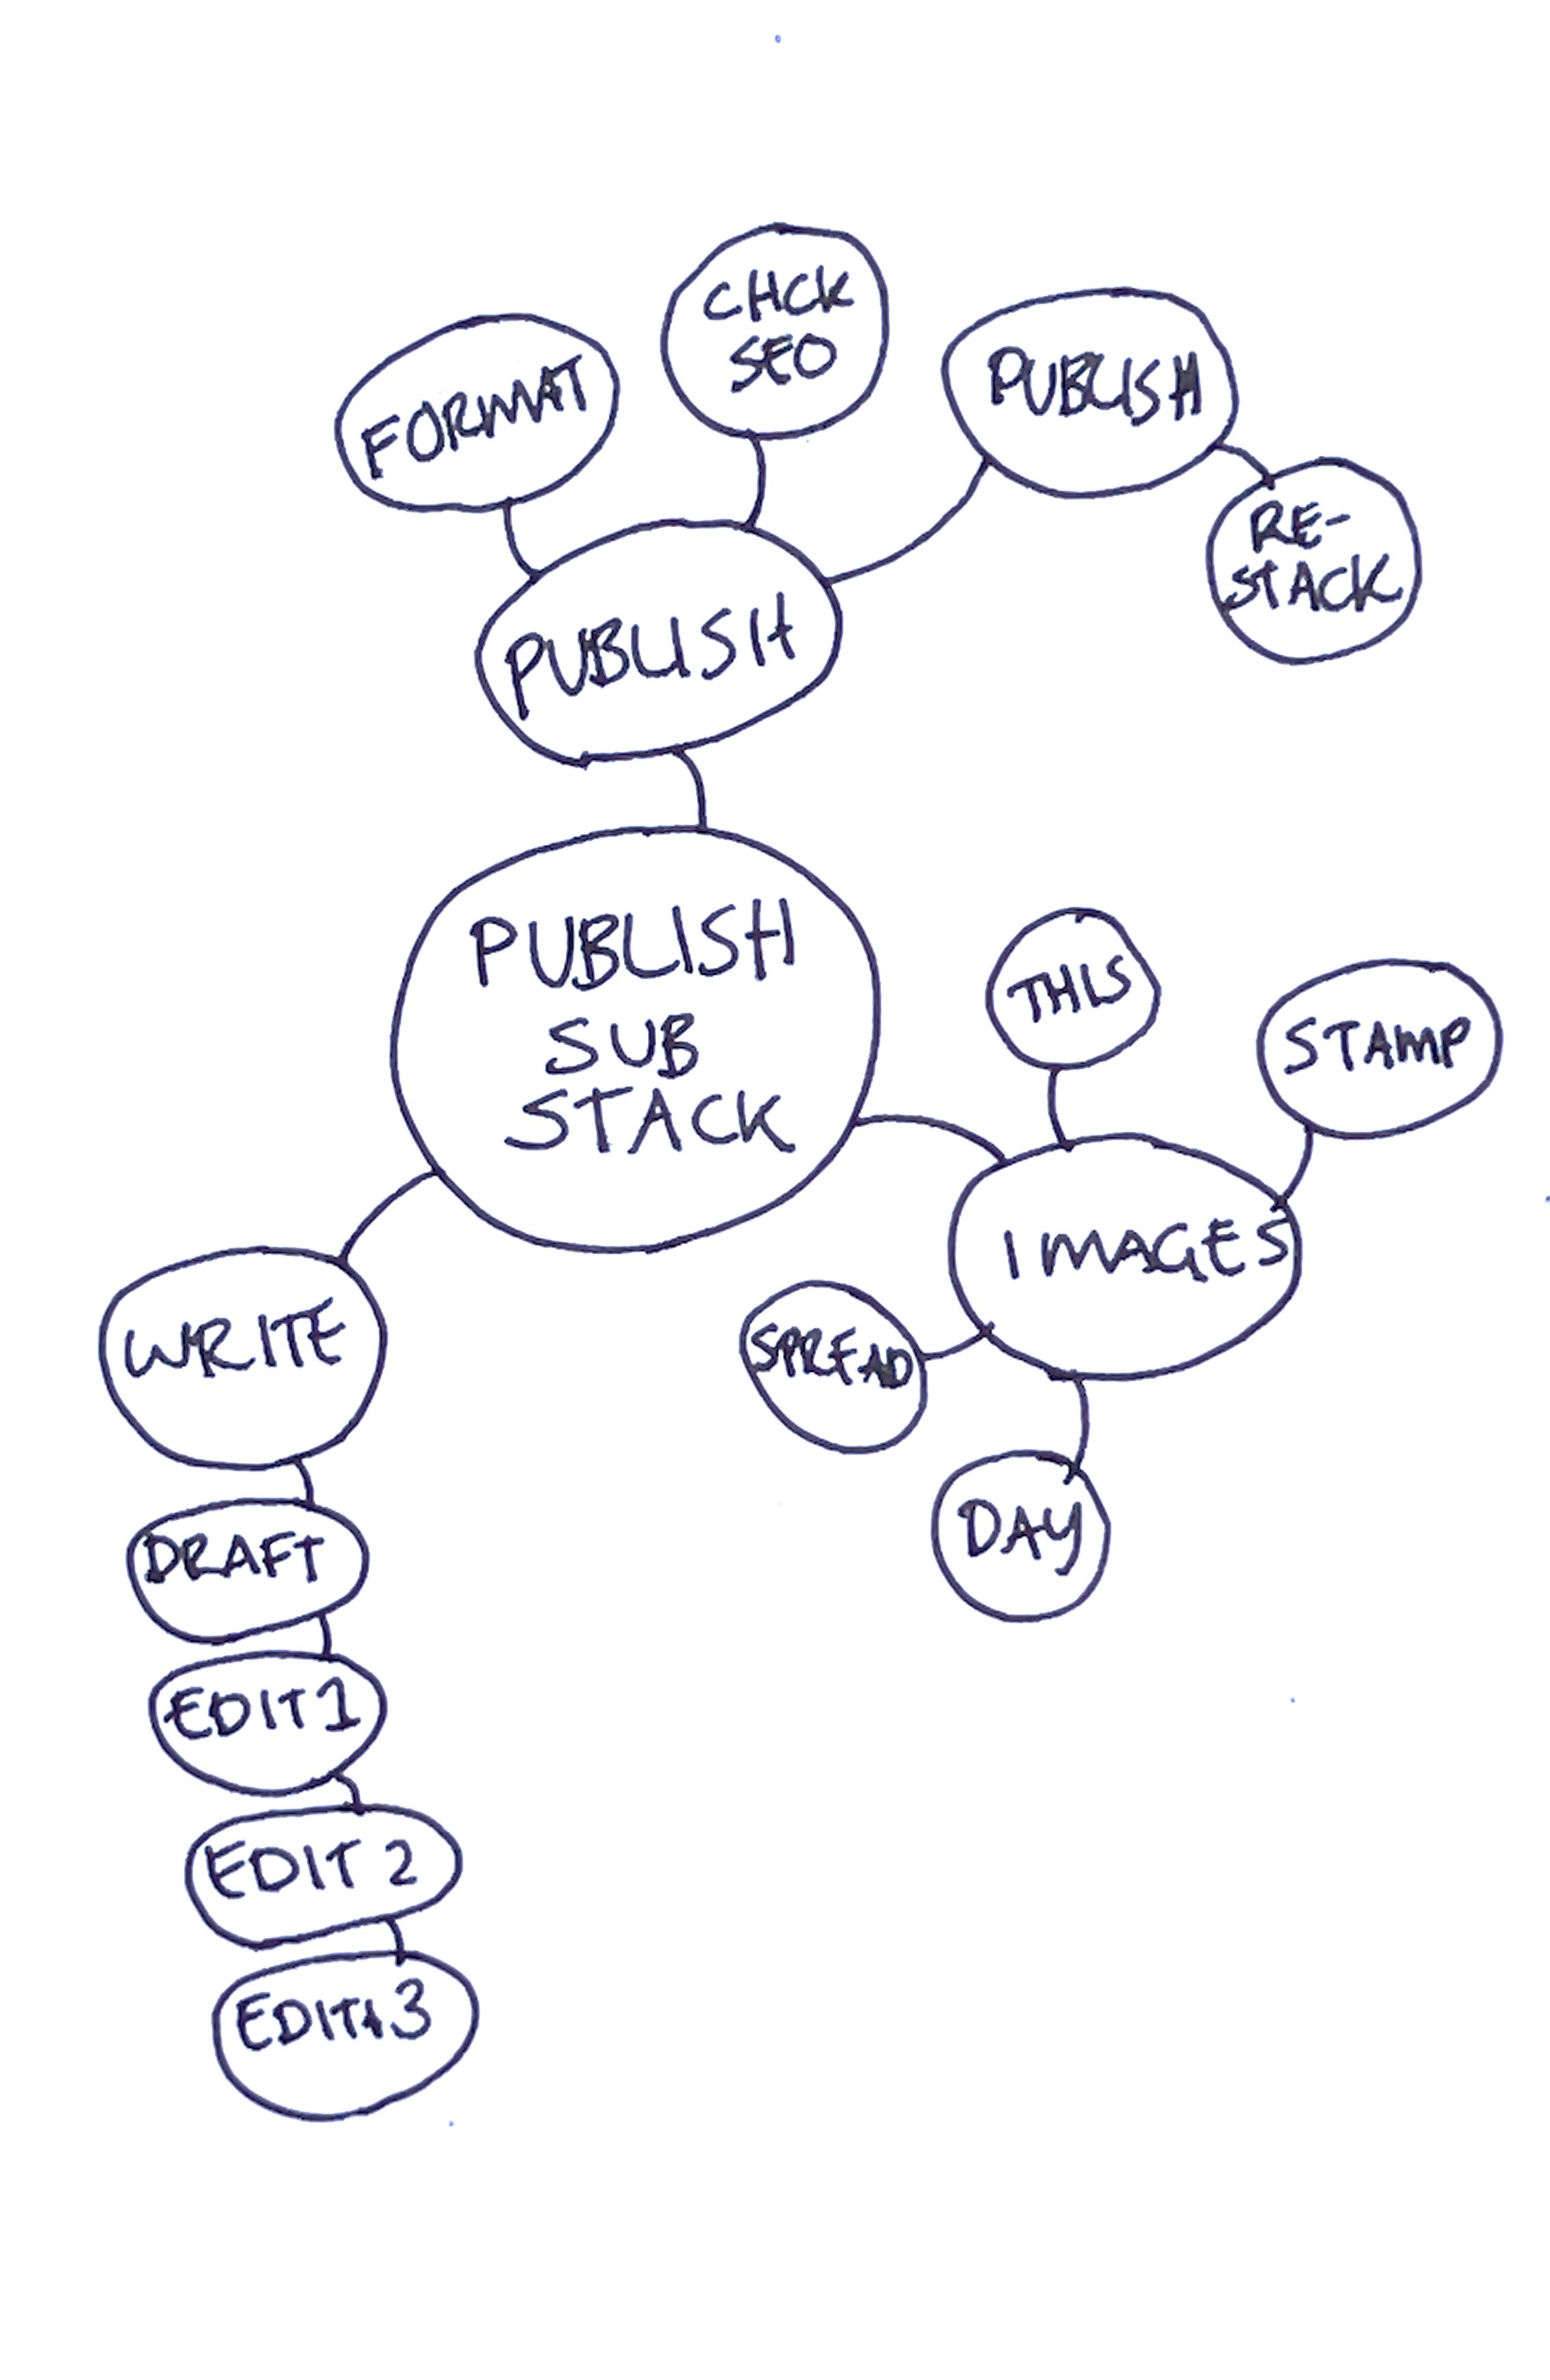
And if one thing needs to be done first before the next thing can happen, they can go into a chain, like ‘write’ in the diagram above.
Then when each sub-task gets done, it gets marked off. Eventually I can mark the big project ‘done’.
A couple of good things happen when I plan this way.
THE BIG PROJECT IS THE THING, NOT THE TASKS
First, seeing all the tasks as sub tasks of the big project reminds me my purpose is to get the big project done - and that eliminating some of the sub-tasks can be a good thing. If everything is in a list, I have a sad tendency to believe the aim is to check every single thing off the list. But of course that’s not true - the aim is to get great quality projects completed without using too much time.
VISUAL SCALE
The most important projects are in bigger bubbles and that lets me instantly know what is the best thing to do next. A standard list is scale free - every item on a list is the same size as the next, so it looks as if everything is similarly important and they obviously aren’t! So each time I looked at a list of things to do, I would have to spend extra time analysing which tasks are more important than others - so another layer of overwhelm hits before I get started on doing anything.
BOUNDARIES
The page acts as a bound space, and limits how much I can fit on the page.
Just like the week, really, which is a bound stretch of time that can only fit in a certain number of things. Making this visual parallel to the bound time of the week and the bound space of the page helps with not overloading my week with too much stuff, failing to do it all and then hating myself for being a failure.
If it can’t fit on the page, it can’t fit into my time either.
Lists can get unrealistically long fast, because the format is so compact. And a digital list? They can just keep going forever, unlike you, a real human.
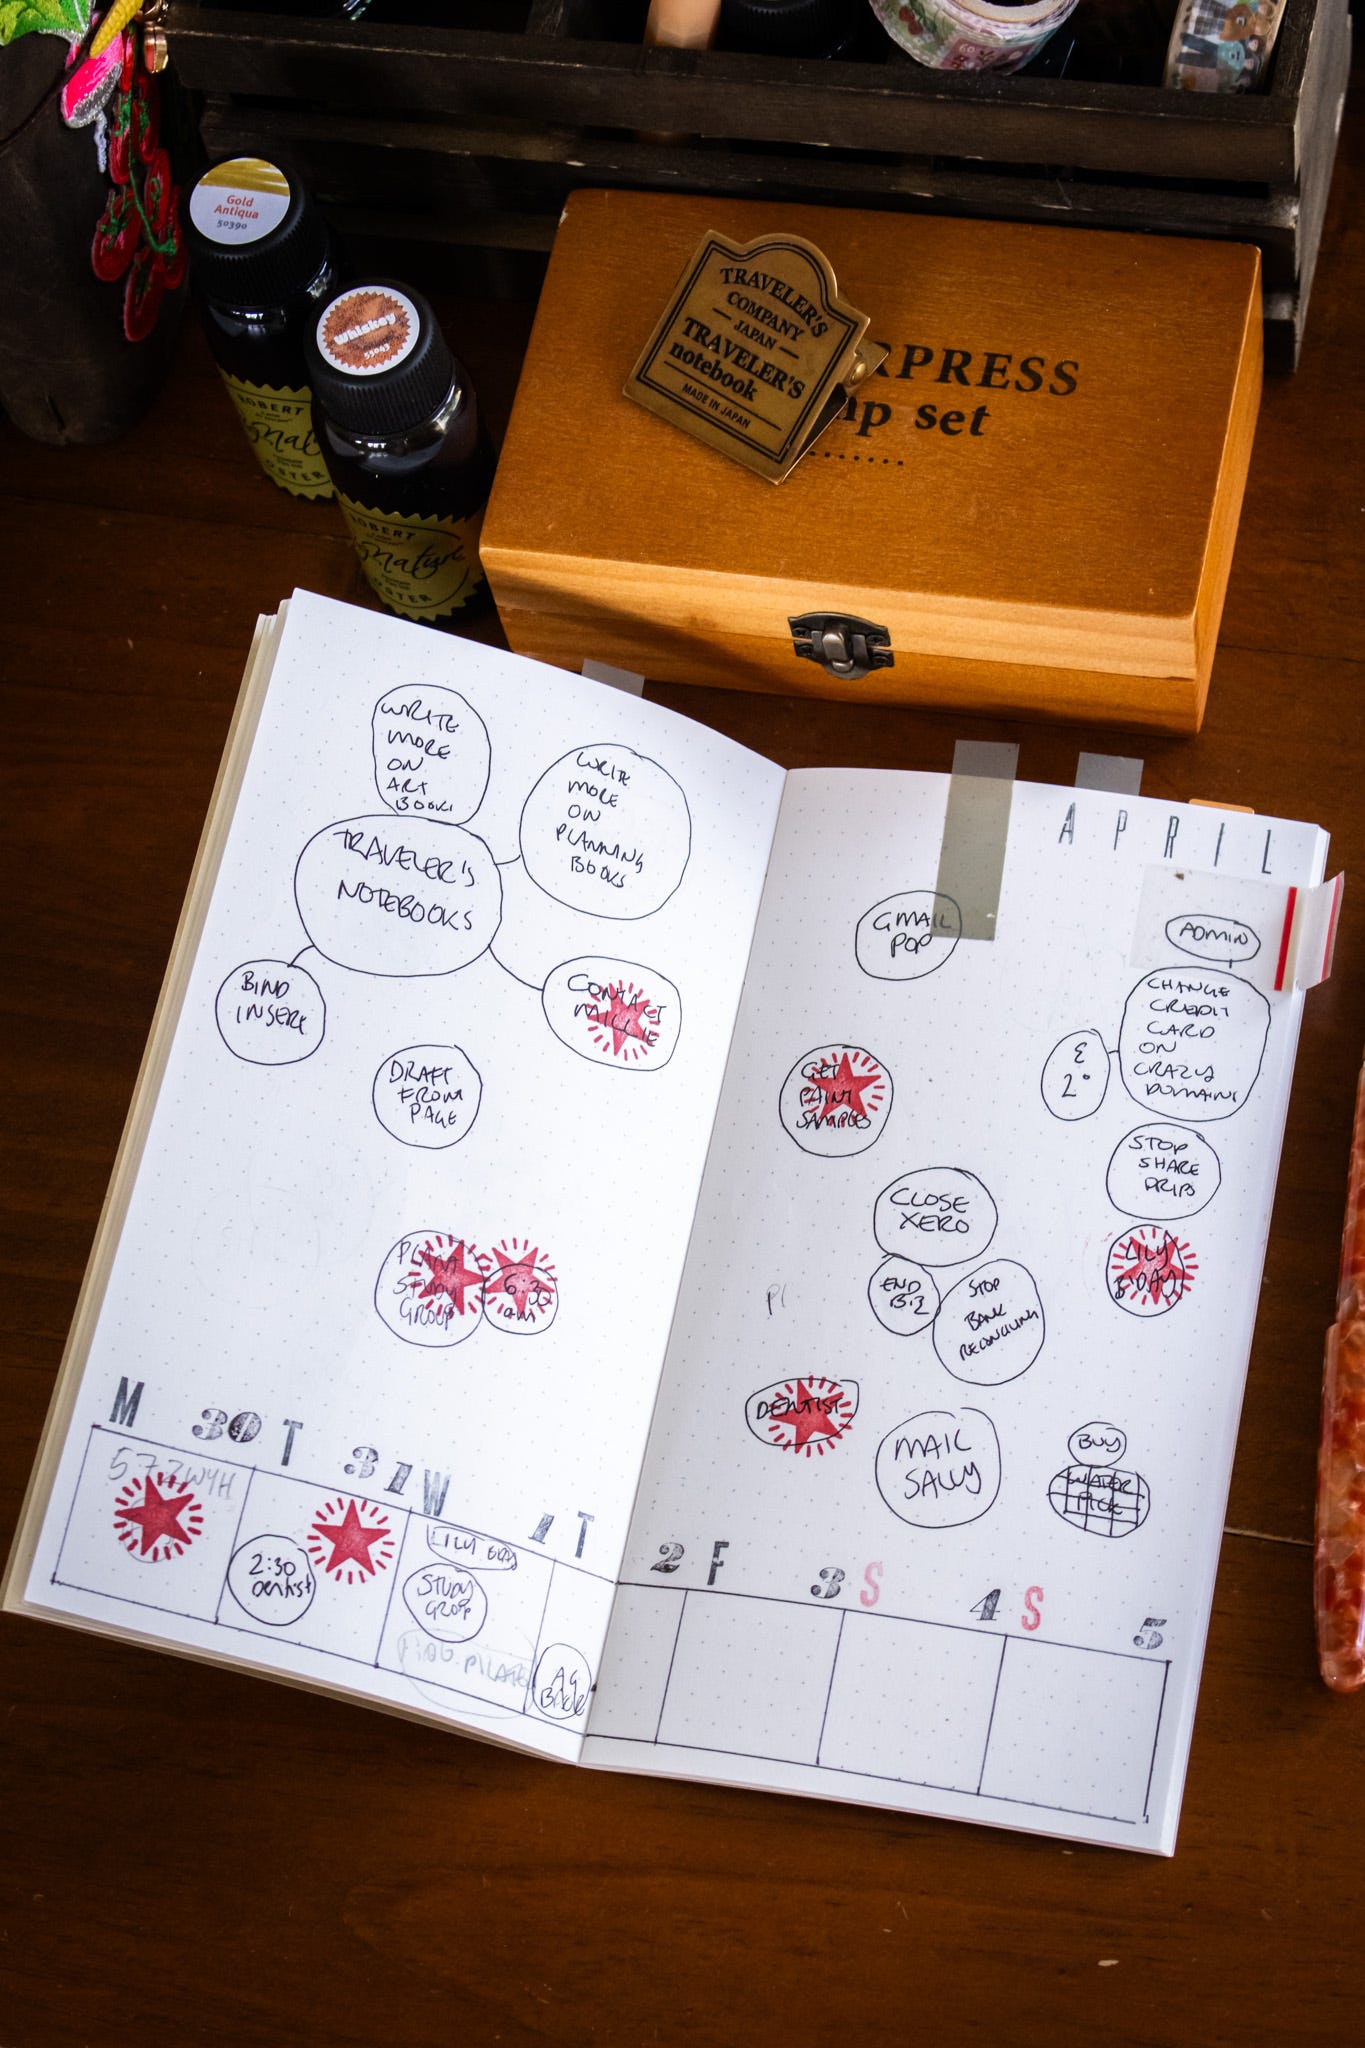
APPLYING THE BOUNDARIES - THE SPACE OF THE PAGE AND THE SPACE OF TIME ARE THE SAME LIMIT
If I suddenly remember I have to check the insurance (or something a bit complicated that I cant just do in a few minutes) It DOES NOT get written it down on this current week. This week is already full!
The page after the weekly spread in my workbook is blank (and messy) to catch all the stray idea, silly or brilliant, that arrive.
Then, on a Sunday or maybe Monday morning, I take the time to carefully draw my weekly time bubble diagrams.
The slow careful act of diagraming calms me, and this calmness really helps with planning. Otherwise I am inclined to get a large mountain of ideas and just excitedly write them into an enormous ‘must do’ list of every single thing that has flown into my brain.
I think this is probably the number one way to create space in your life. Via acknowledging the space of your time.
DONE
Giving myself a star stamp when I have finished is so satisfying. I bang my stamp down and get a real sense of celebration. If I don’t have my stamp with me, I slowly cross hatch the whole bubble. That way I get a little space of time to absorb the satisfaction of finishing.
This next part may be relates to the way my brain obsessively over-processes everything in my visual field. But if I can still easily read what is inside a ‘done’ bubble, I will keep on thinking about the finished task all over again, and will start worrying that I haven’t done it well enough, or go over it obsessively in some other unhelpful way.
But if I can no longer see it due it being completely crossed out or stamped over, I won’t keep re-processing it. It is more truly done to my brain and stops taking up space there.
THE REST OF TIME - DAYS, YEARS, SECTORS
I started with organising my weeks this way, and as overwhelm reduced, I started to diagram other time scales too.
YEARS
I do a yearly plan with all the big ideas. I spend a SUPER long time going over all the things that went well in the past year.
The negativity bias is strong and will convince you to only see all the negative things, so that all your planning starts with scarcity and fear.
If you think first about what has been working well for you then planning comes from a feeling of security and accomplishment. Doing MORE of the things that work is better than trying to ‘correct’ for all our perceived shortcomings. That’s just too big of a job to be achieved!
BREAKING IT INTO SECTORS
I used to break the year into quarters but now I break it down into six sectors lasting two months each.
For some reason, I could not quite hold the time span of a whole quarter in my mind very well. It seemed like a vague huge stretch of time and I would think I could cram 1,000 things into the quarter.
But when I think of eight weeks, it’s a time span my brain can grasp, and actually see how many things I am truly likely to fit into this sector. I suspect everyone differs a bit on how much time they can easily and honestly visualise all at once.

DAYS
Finally days - first I journal a little bit on all the things that went well the day before. Almost every day I am surprised by how many of the positive things my brain has deleted overnight and it is quite a bit of work to dredge up the good things. However all the bad things are always crystal clear and super present.
So correcting that negativity bias is ongoing, daily work.
Then I look at the weekly spread and put the things I will do that day onto a (larger sized) sticky note, which gets clipped to the outside of my workbook so I can see it clearly.
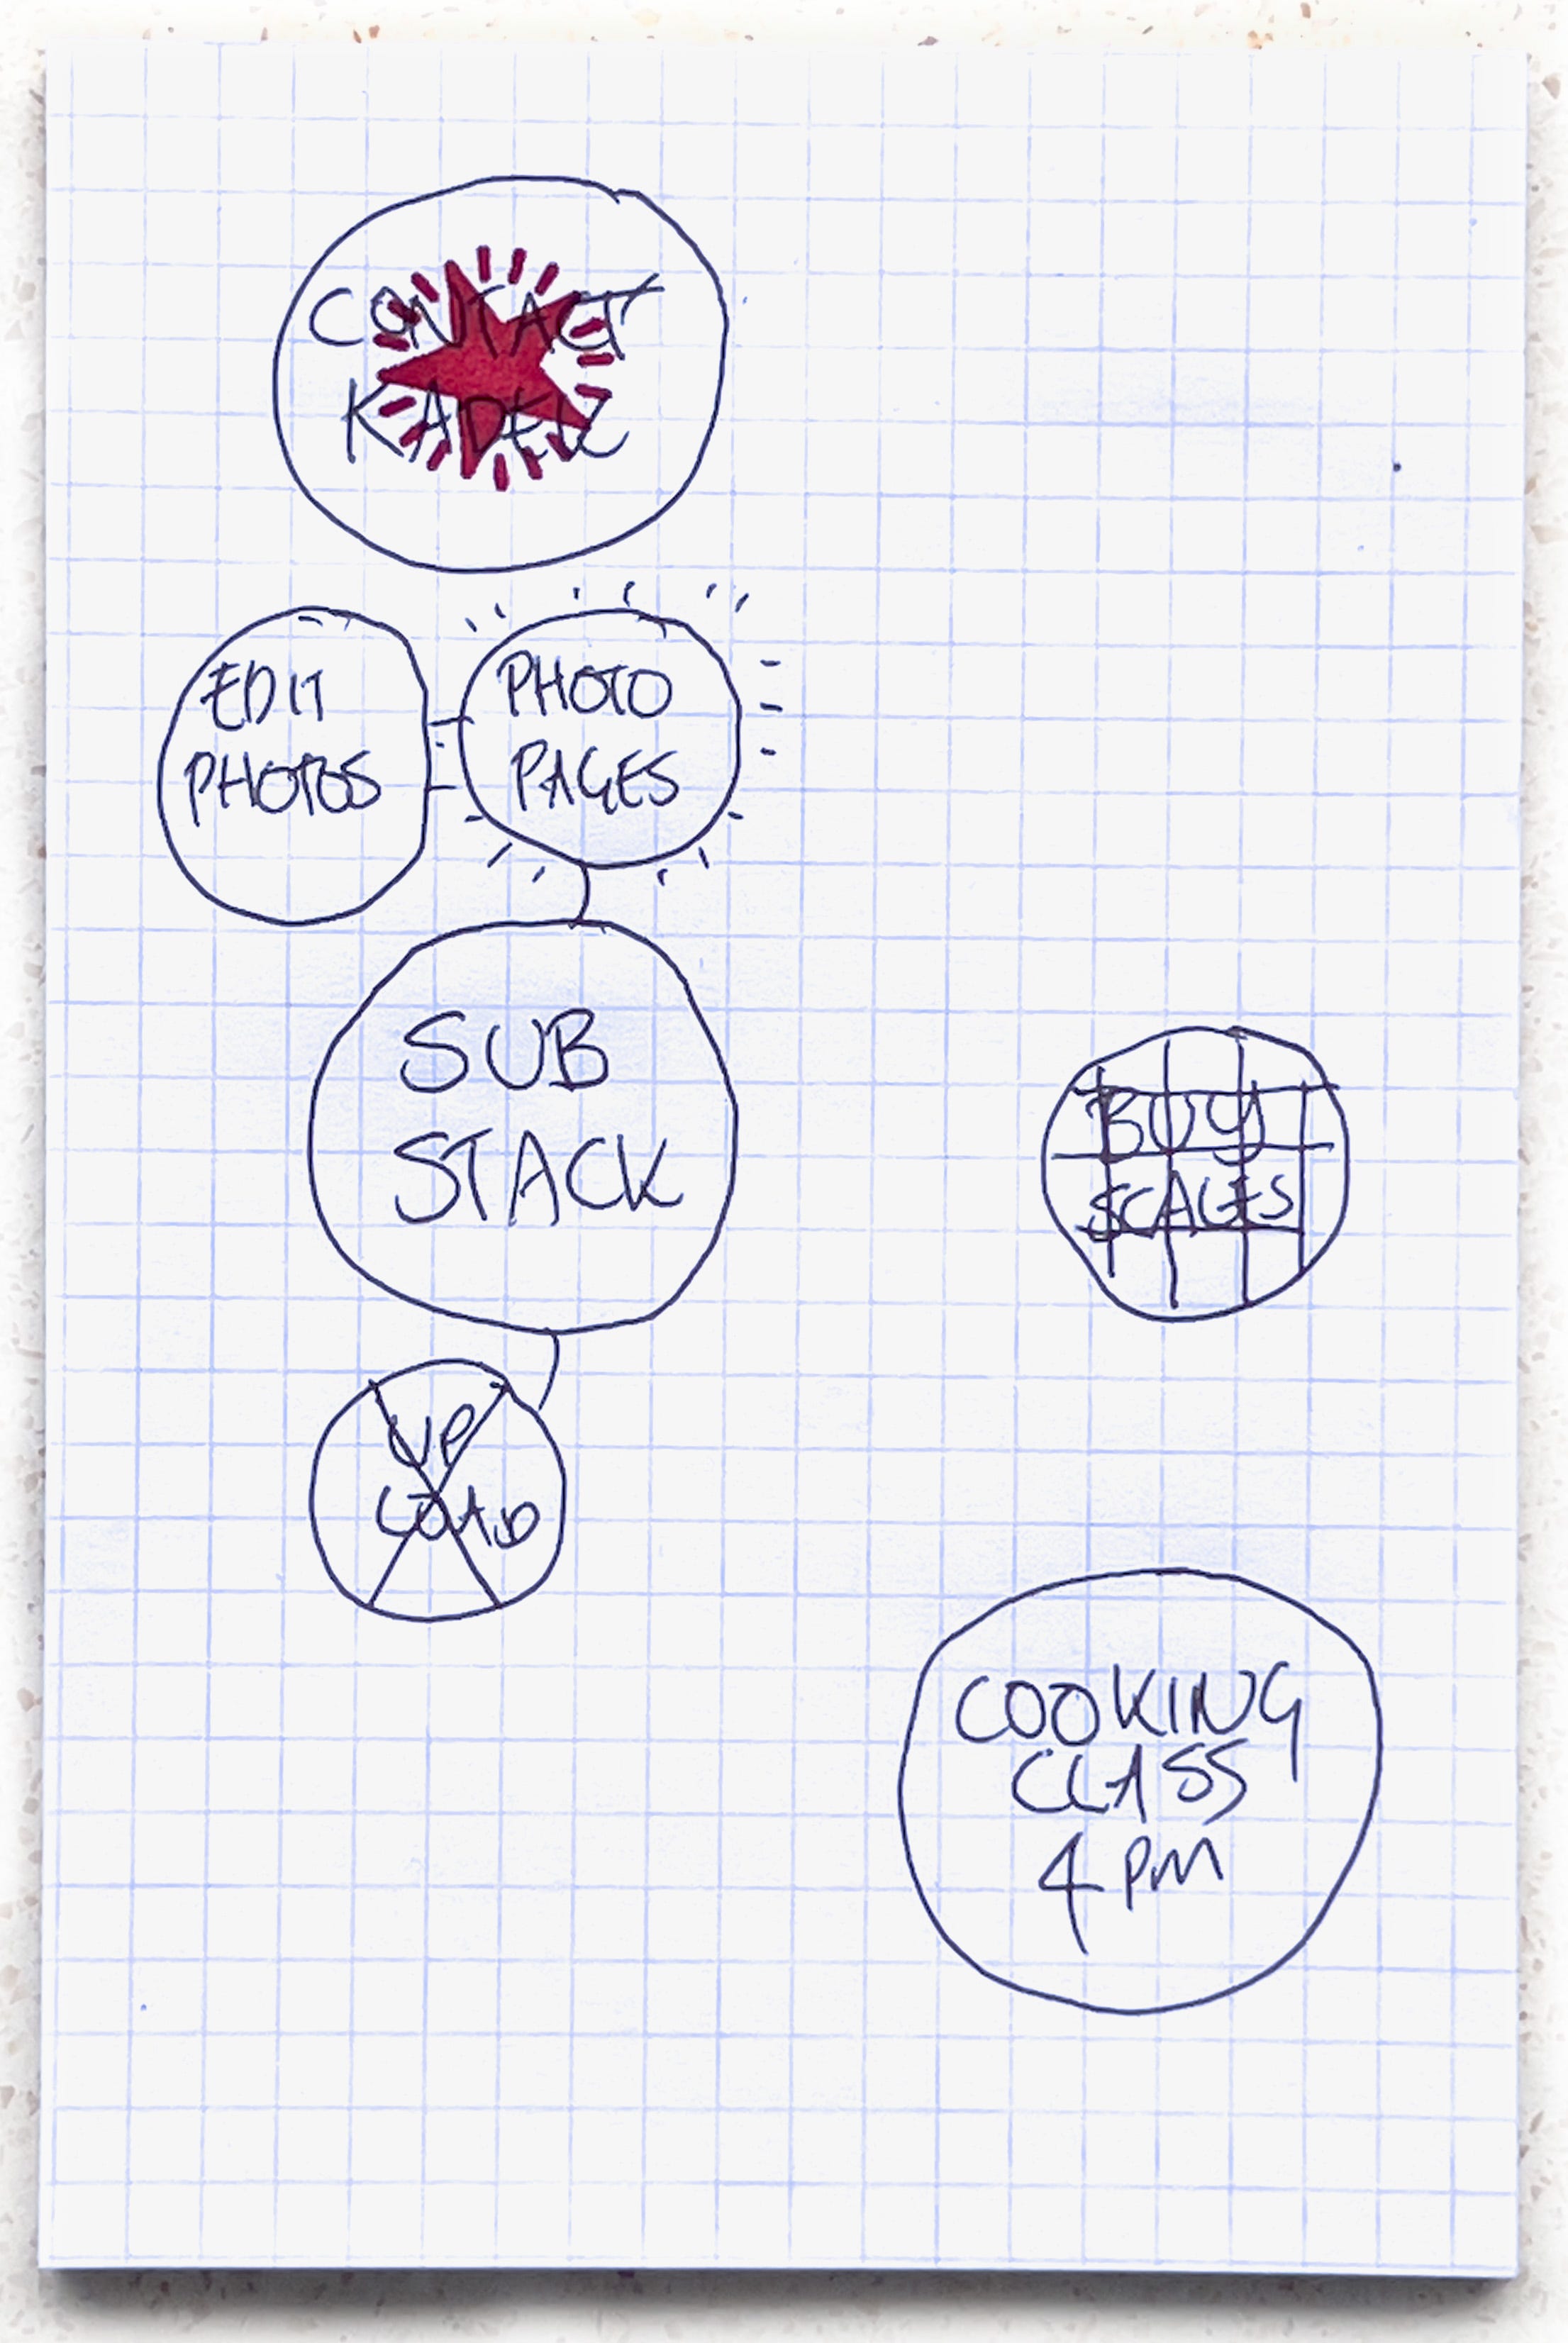
FINALLY, A VISUALISATION THAT HELPS ME EVEN MORE
Sometimes I will spend extra time visualising my work as a storage space filled with opaque spheres, each filled with a project that I can choose to do.
I pick up one of the spheres, break it open, and now the work contained within is visible and there for me to focus on.
Everything else is inside it’s own bubble, waiting patiently and not visible to me until I have dealt with the one project whose bubble I have burst, and cleaned up all the things associated with it.
Then I can calmly take out the next sphere from the storage space and break open that project to focus on.
Well, anyone who knows me knows my life is not like that in reality - I am a distracted and messy normal being. But I would be so much worse without this lovely set of tools.
LOVE THIS! going to try it immediately - this feels so much better than pages of long written lists, which make me sad and anxious x
Oh my, I loved this! I think it would have been super helpful in my work life, but now I’m retired, I’m much more easily in control of me. Even now though, as I’m writing my book, I have still relied on a massively messy mind map to cross ref things that connect, which a list would absolutely not allow me to do. Thanks for this and keep bubbling and stamping ❤️